MIND-large · held-out test · 3 seeds · locked model
Which past clicks really mattered
MIND-large
held-out test
3 seeds
locked model
explainability
The notepad can say which past events drove each score. We tested that claim on the locked Table 2 model: delete the events it names, score again, and see how far the scores move. Then we did the same with four other ways of picking events, including the standard explainer used for any neural network. This covered every MIND-large test impression, on all three trained seeds.
Takeaway
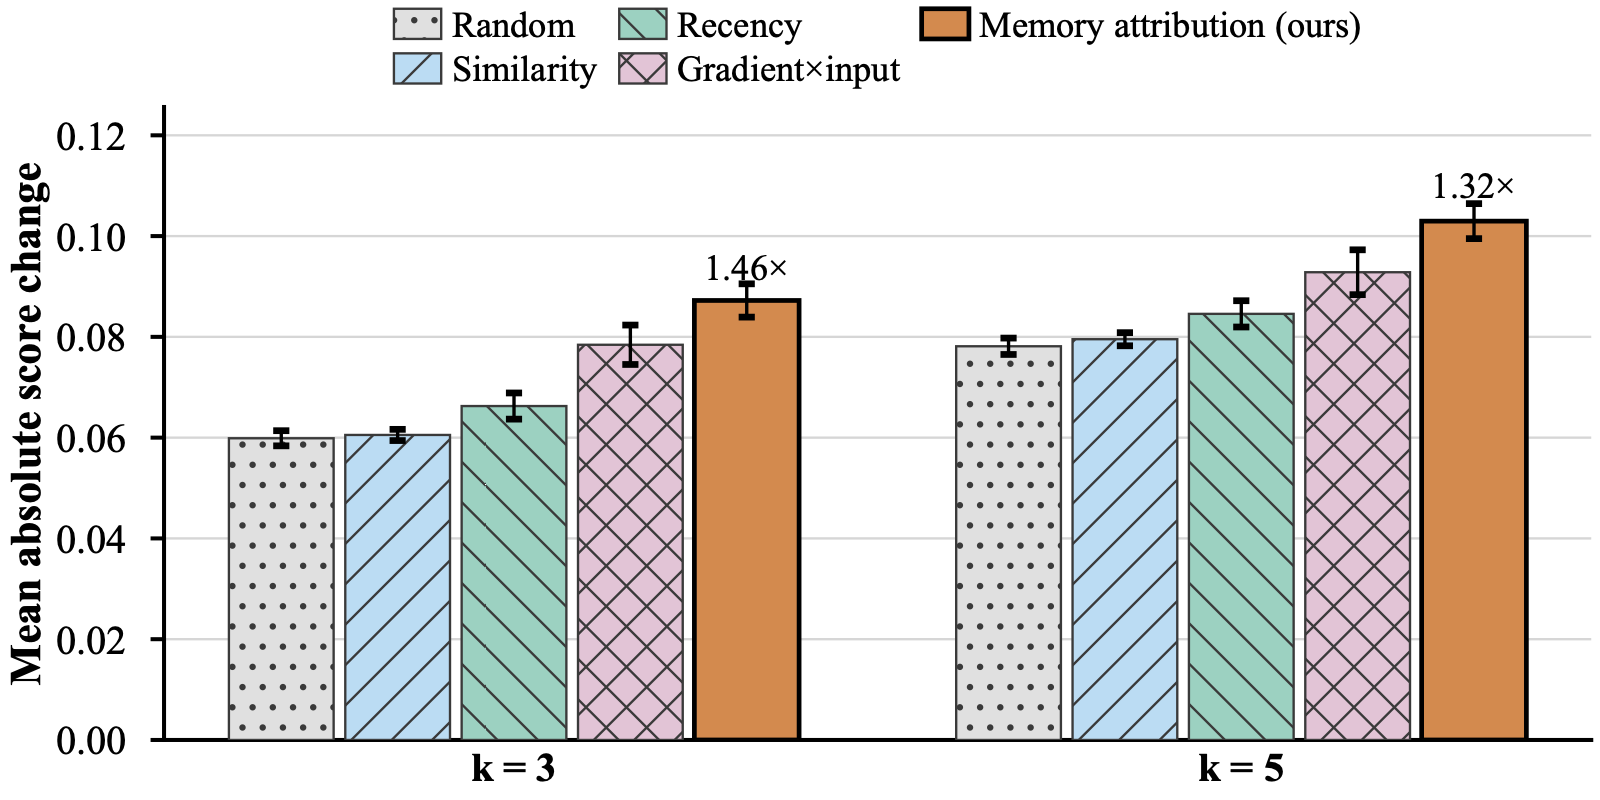
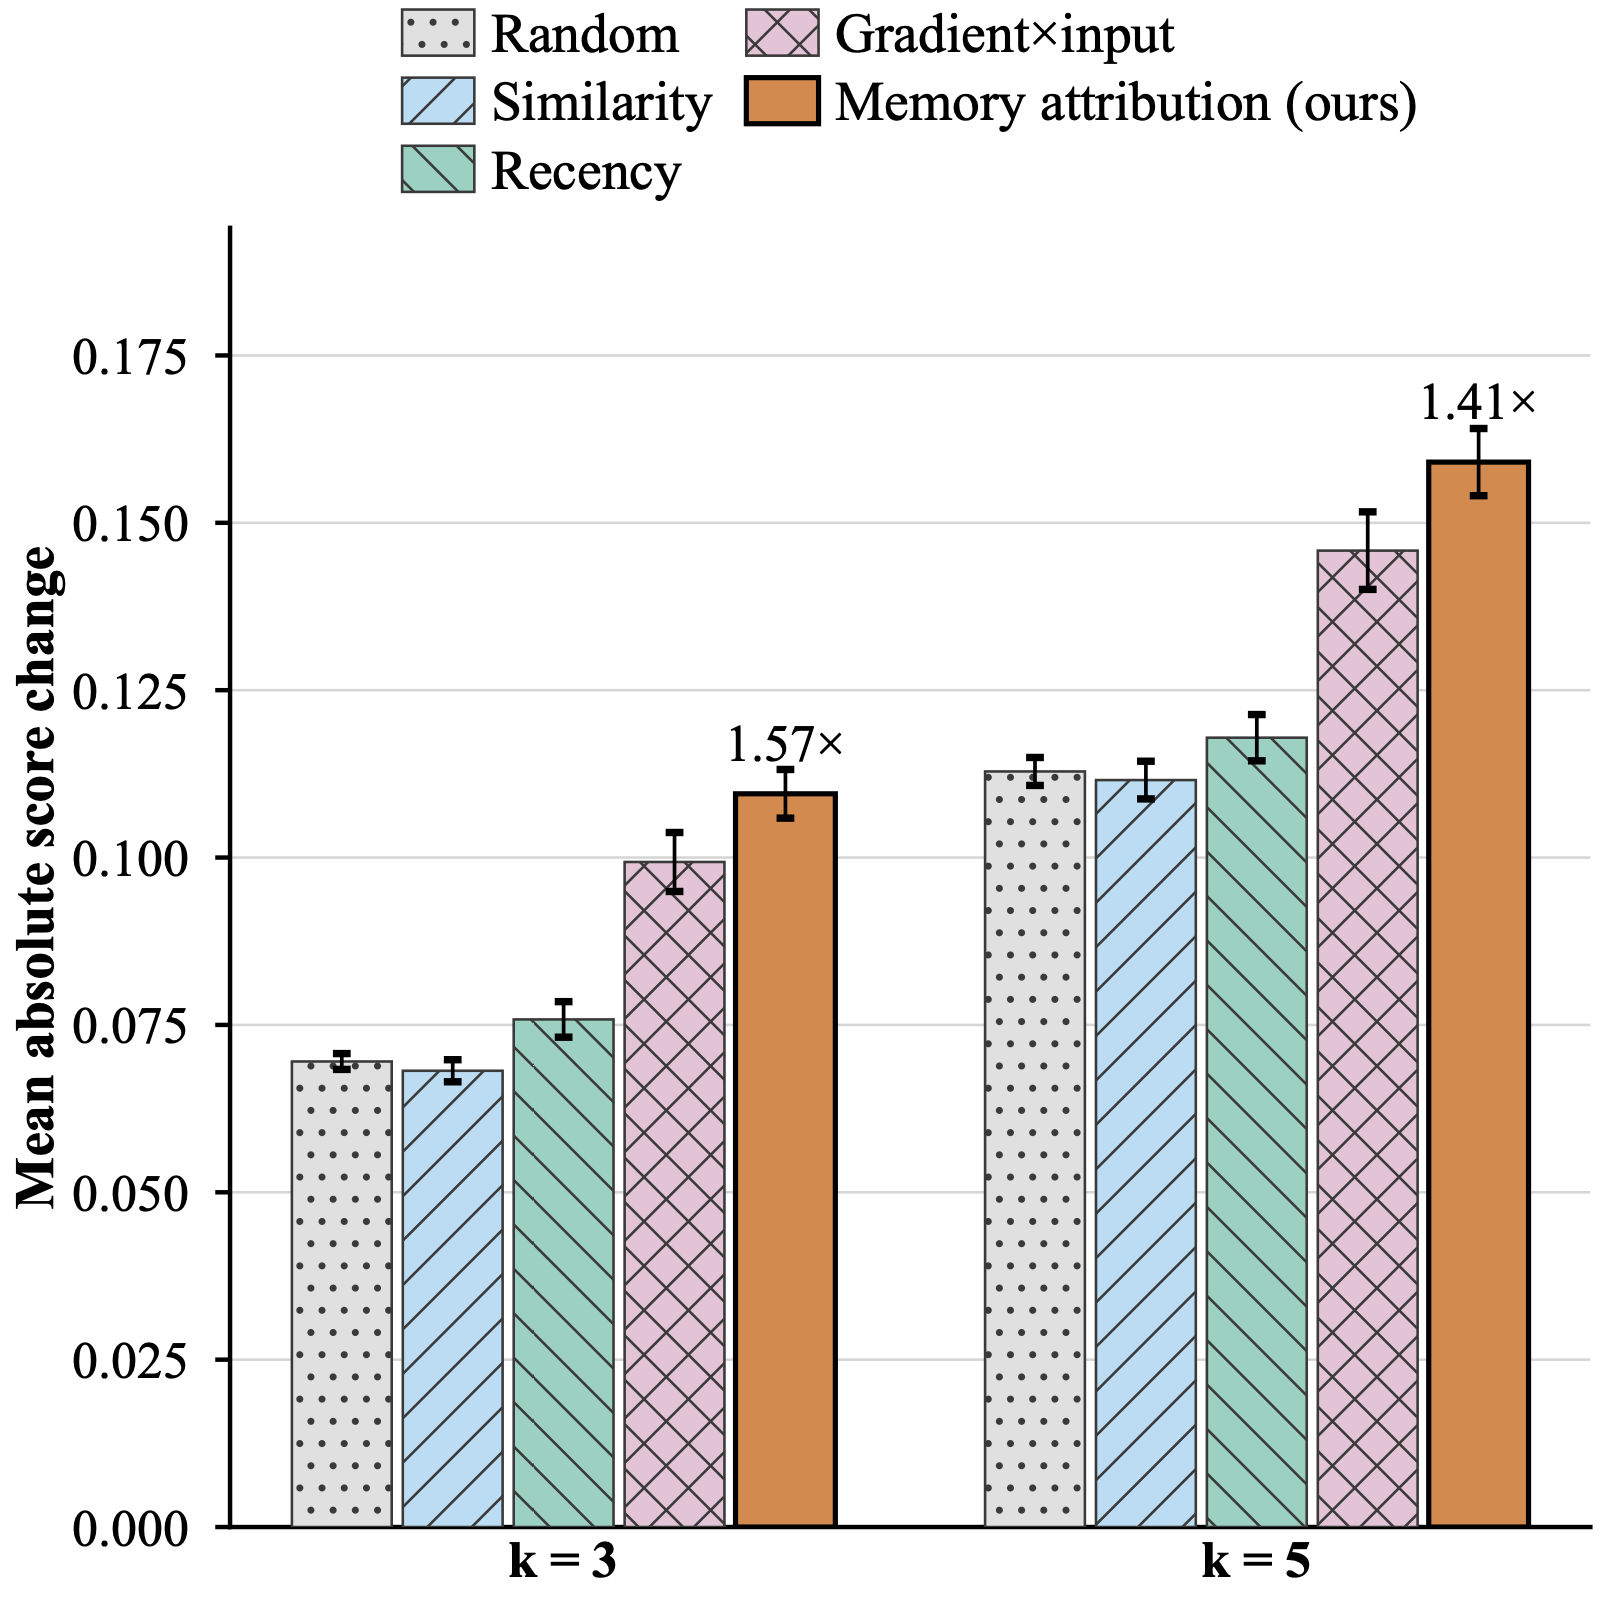
The model’s own explanation finds the events that matter best, beating every other picker in every seed. The margin is modest: its picks move the scores 1.3–1.6× as much as random picks.
369,454Test impressions explained, per seed
+46%More score movement than random (A, delete 3)
12 / 12Seed-by-cell checks where it beat the next-best picker
The test
If an explanation is right, removing the events it names should change the scores a lot. Removing random events should change them less.
Five ways to pick the events
Memory attributionThe model’s own account, read from its memory, of what each event added to the score.
RandomAny events. The baseline.
Most similarPast articles closest in topic to the ones being scored.
Most recentThe newest events.
Gradient × inputThe standard explainer for any neural network: the events the score is most sensitive to.
Two ways to delete
The notepad holds the last 20 events. Only those can be deleted, because only they get a memory attribution.
Results
How much more the scores moved than when the same number of random events was deleted. The mean is over 3 seeds; hover a bar for ± spread.
Picker
A · delete 3
A · delete 5
B · delete 3
B · delete 5
Random
1.00× · 29%
1.00× · 38%
1.00× · 18%
1.00× · 25%
Most similar
1.01× · 30%
1.02× · 39%
0.98× · 19%
0.99× · 27%
Most recent
1.11× · 33%
1.08× · 41%
1.09× · 23%
1.04× · 30%
Gradient × input
1.31× · 38%
1.19× · 45%
1.43× · 28%
1.29× · 34%
Memory attribution
1.46× · 42%
1.32× · 49%
1.57× · 31%
1.41× · 38%
Each cell shows score movement relative to random, then the share of impressions where the top-ranked article changed. Memory attribution beat gradient × input in all 12 seed × cell comparisons. Across seeds, the spread in score movement is at most ±0.006.
Why not 12× like the old run?
The old model forgot fast. Most of the ~49 events it could delete had already faded to almost nothing, so random deletions barely mattered.
So its 12× mostly meant “recent beats forgotten”. It had no most-recent picker to check this. On the old run’s own pages, random even beat its attribution on clicks, which fade slowly.
Here every candidate event still counts. Only the 20 notepad events can be deleted, and on MIND-large nothing fades, so random is a much harder baseline. The margin is smaller but more honest.
What this does not show
One dataset (MIND-large). Other datasets and attention baselines were not run.
The attribution ranks events well, but its size is not a forecast of how far a deletion will move the score.
Topic similarity alone explains nothing here; what the notepad tracks goes beyond “same topic”.
Isolated package experiments/isolated/attribution_literal_lab. It uses the three Table 2 FWPRec checkpoints (seeds 42/43/44, locked paper model), MIND-large test, on damlr-w02/w03/w04 (RTX 4080 SUPER), with no training.
Impressions: 369,454 of 376,471 per seed; 7,017 with no history were excluded.
Checks, per seed:
· The engine reproduces the archived Table 2 scores (max difference ≤ 1.8e-7).
· The per-event credits add up exactly to each score (residual ≤ 4.2e-7).
· An 11-test gate, including an independent delta-rule reference and a gradient check against autograd.
Deleting 3 or 5 events; pool = the ≤ 20 notepad events (15.5 on average). The random picker is seeded per checkpoint. This replaces the older MIND-small blamed-clicks run, which used a different model.
Paper figures
Publication versions of this page's charts, as PDF. Each series or cell is encoded twice (colour plus pattern, marker or printed value), so they read in greyscale and under colour-vision deficiency. Click a preview to open the PDF.
Setting A · as deployed — Score movement after deleting 3 or 5 events; ± spread over 3 seeds. PDFSetting B · notepad only — Same test with no older event sliding in. PDF